
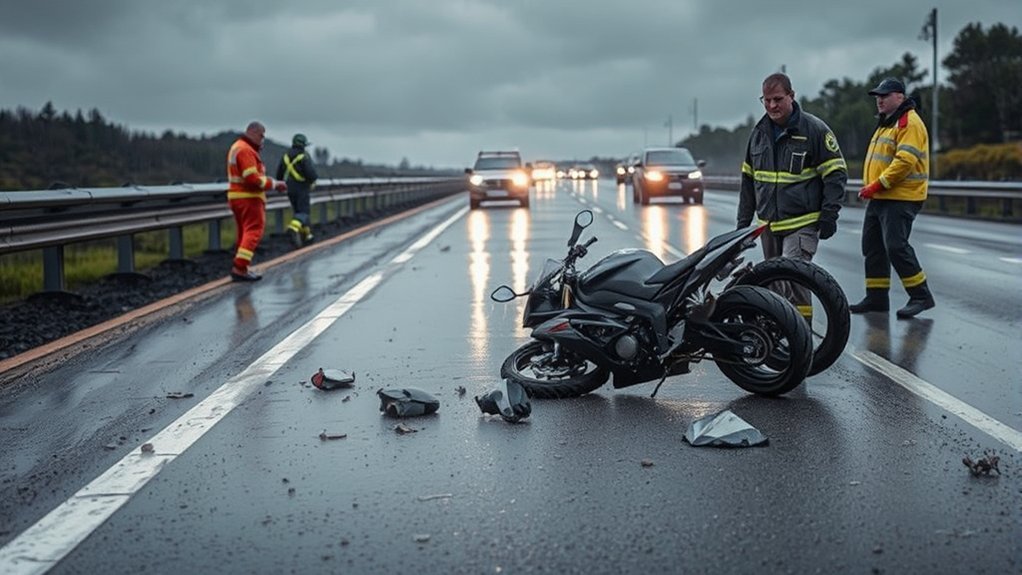
Motorcycle accident statistics show why riders need more protection, training, and room on the road. Federal safety agencies usually use the word “crash” instead of “accident,” because many contributing factors can be prevented. The latest detailed U.S. data cover 2024, when motorcycle deaths declined slightly but remained near historic highs.
Quick Answer
In 2024, 6,228 motorcyclists were killed and an estimated 86,887 were injured in U.S. traffic crashes. Motorcycles were 3% of registered vehicles but represented 16% of traffic deaths. Per mile traveled, the motorcyclist fatality rate was almost 27 times the passenger-car occupant rate.
Key Takeaways
- Motorcyclists accounted for 16% of U.S. traffic deaths in 2024 despite motorcycles making up only 3% of registered vehicles.
- The 2024 motorcyclist fatality rate was 28.00 per 100 million vehicle miles traveled, almost 27 times the passenger-car occupant rate.
- Speeding, alcohol impairment, improper licensing, left-turn conflicts, and limited visibility are major fatal-crash patterns.
- Helmets reduce the risks of death and head injury, but no helmet or other item of gear can make a crash harmless.
- Training, sober riding, legal licensing, pre-ride checks, protective gear, and motorcycles equipped with ABS can all help reduce risk.
Note: The latest complete national motorcycle dataset is for 2024. A July 2026 NHTSA projection suggests motorcyclist deaths declined by about 8% in 2025, but that estimate is preliminary and may change when final 2025 data are released.
Why Motorcycle Accident Statistics Matter for Your Safety
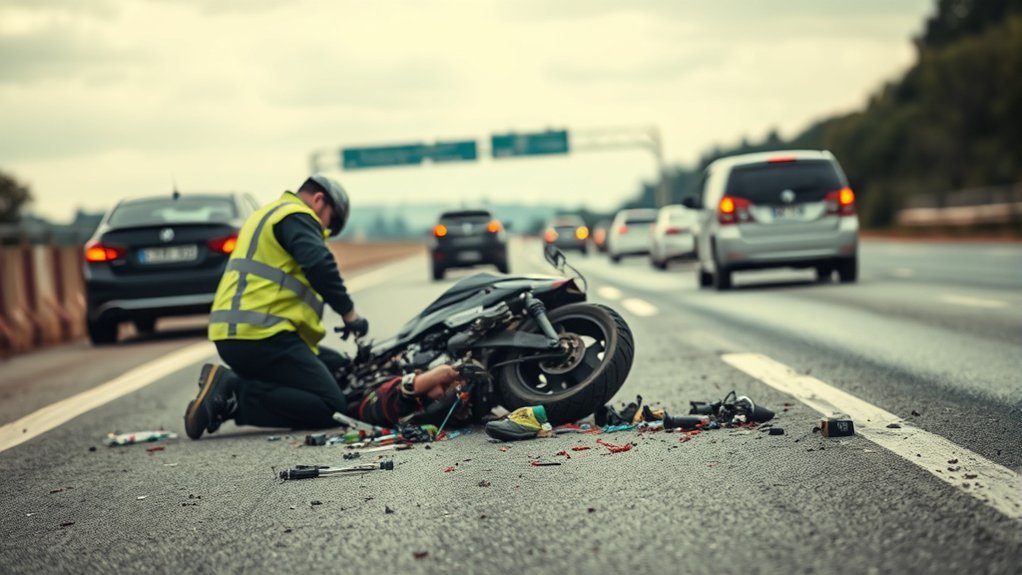
Motorcycles offer little of the crash protection found in a passenger vehicle. Riders do not have an enclosed body structure, seat belts, or large crumple zones around them. Motorcycles can also be harder for other road users to see, especially at intersections or when hidden by larger vehicles.
According to the National Highway Traffic Safety Administration’s 2024 motorcycle fact sheet, motorcycles made up 3% of registered U.S. vehicles and only 0.7% of vehicle miles traveled. However, motorcyclists represented 16% of all traffic fatalities.
Per mile traveled in 2024, the motorcyclist fatality rate was almost 27 times the passenger-car occupant fatality rate.
This comparison does not mean every motorcycle trip is exactly 27 times as dangerous as every car trip. It compares national fatality rates per vehicle mile traveled. An individual rider’s risk also changes with speed, experience, impairment, road design, weather, traffic, protective equipment, and motorcycle type.
U.S. Motorcycle Accident Statistics at a Glance
| 2024 measure | National finding |
|---|---|
| Motorcyclists killed | 6,228 |
| Motorcyclists injured | An estimated 86,887 |
| Share of all traffic deaths | 16% |
| Share of registered vehicles | 3% |
| Share of vehicle miles traveled | 0.7% |
| Fatality rate per 100 million miles | 28.00, almost 27 times the passenger-car occupant rate |
| Riders in fatal crashes without a valid motorcycle license | 35% |
| Riders in fatal crashes who were speeding | 37% |
Fatality figures from NHTSA’s Fatality Analysis Reporting System are actual counts from qualifying public-road traffic crashes. National injury figures come from a sample-based system and are estimates rather than exact counts.
How Motorcycle Injuries and Fatalities Have Changed Over Time
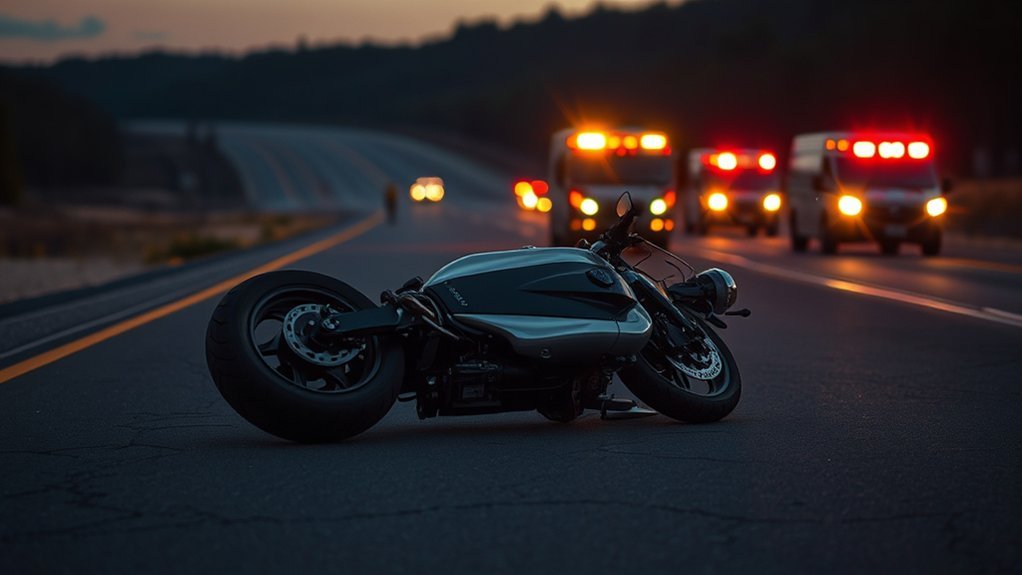
Motorcyclist deaths have risen substantially from the lows recorded in the late 1990s. The 2024 total was below the revised 2023 count, but it remained higher than every year from 1976 through 2020.
| Year | Killed | Estimated injured | Fatality rate per 100 million VMT |
|---|---|---|---|
| 2015 | 5,029 | 88,738 | 25.65 |
| 2019 | 5,044 | 83,814 | 25.62 |
| 2020 | 5,620 | 80,662 | 31.31 |
| 2021 | 6,144 | 84,898 | 31.28 |
| 2022 | 6,251 | 82,690 | 26.30 |
| 2023 | 6,366 | 82,567 | 31.54 |
| 2024 | 6,228 | 86,887 | 28.00 |
Deaths fell 2.2% from 2023 to 2024, while estimated injuries rose 5.2%. The fatality rate per mile also declined, from 31.54 to 28.00 per 100 million vehicle miles traveled.
Long-term comparisons require care. NHTSA changed its vehicle-classification method beginning with 2020 data. Beginning in 2022, motorized bicycles were also moved out of the motorcycle category. Those changes mean some newer figures are not directly comparable with older figures.
Leading Risk Patterns in Fatal Motorcycle Crashes
Crash statistics identify common patterns, but they do not decide legal fault in an individual case. A police investigation may find several contributing factors involving the rider, another driver, the road, weather, or the vehicle.
Left-Turning Vehicles and Intersections
In 2024, there were 3,396 two-vehicle fatal crashes involving a motorcycle and another vehicle. In 45% of them, the other vehicle was turning left while the motorcycle was traveling straight, passing, or overtaking.
This figure applies only to two-vehicle fatal crashes. It does not mean that left-turning drivers were involved in 45% of every motorcycle crash. Overall, 38% of motorcyclist fatalities occurred at intersections, while 62% occurred away from intersections.
Riders should reduce speed when approaching intersections, watch vehicle wheels and driver head movement, avoid lingering in blind spots, and prepare to brake or change position. Drivers should look twice for smaller road users before turning across traffic.
Front Impact Is Not the Same as a Head-On Crash
In two-vehicle fatal crashes, 78% of motorcycles were impacted on the front and 6% on the rear. A front impact can occur when a motorcycle strikes the side of a turning car, a stopped vehicle, or another object. It should not automatically be described as a head-on collision.
Speeding
NHTSA classified 37% of motorcycle riders involved in fatal crashes in 2024 as speeding. That was higher than the percentage for passenger-car, light-truck, or large-truck drivers in fatal crashes.
Speeding includes more than exceeding the posted limit. A crash can be classified as speeding-related when a rider is racing, traveling too fast for road or weather conditions, or charged with a speeding offense.
Licensing and Training
Thirty-five percent of motorcycle riders involved in fatal crashes in 2024 did not have a valid motorcycle license. A regular automobile license without the required motorcycle endorsement is not considered a valid motorcycle license for this measure.
Proper licensing does not guarantee safe riding, but it confirms that a rider has completed the state’s required knowledge and skills process. A state-approved rider course can also provide controlled practice in braking, turning, swerving, and hazard recognition.
Single-Vehicle and Multiple-Vehicle Crashes
In 2024, 35% of motorcyclist deaths occurred in single-vehicle crashes and 65% occurred in crashes involving more than one vehicle. Single-vehicle crashes may involve roadway departure, loss of control, rollover, or a collision with a fixed object.
Multiple-vehicle crashes often involve visibility, right-of-way, turning, following-distance, or lane-position conflicts. Riders still need to manage their speed and escape space even when another road user creates the immediate hazard.
How Alcohol Affects Motorcycle Safety
Motorcycles require balance, coordination, judgment, accurate vision, and fine control. Alcohol can weaken all of those abilities before a rider feels severely impaired.
In 2024, 25% of motorcycle riders involved in fatal crashes were alcohol-impaired, meaning their estimated blood alcohol concentration was 0.08 grams per deciliter or higher. Among riders who died in single-vehicle crashes, 40% were alcohol-impaired.
Time of day also mattered. Motorcycle riders killed at night were 2.6 times as likely to be alcohol-impaired as riders killed during the day. NHTSA reported impairment among 37% of riders killed at night, compared with 14% during daytime hours.
Warning: Do not ride after drinking alcohol or using an impairing drug. Prescription and over-the-counter medicines can also affect balance, alertness, vision, and reaction time. Check the label and ask a pharmacist or medical professional when you are unsure.
Where and When Fatal Motorcycle Crashes Occur
- Urban areas: 66% of motorcyclist fatalities occurred in urban areas, compared with 34% in rural areas.
- Road type: 91% occurred on non-interstate roads.
- Intersections: 38% occurred at intersections and 62% away from intersections.
- Weather: 97% occurred in clear or cloudy conditions, 2% in rain, and about 1% in snow, sleet, fog, or other conditions.
- Light: 56% occurred in daylight, 38% in darkness, 4% at dusk, and 1% at dawn.
- Season: 57% of motorcyclist deaths occurred from May through September.
- Weekend: 46% occurred from Friday evening through early Monday morning.
These figures do not prove that clear weather or daylight causes crashes. Far more motorcycle travel takes place during warmer, drier, and brighter conditions. Exposure must be considered before comparing the danger of one weather condition with another.
How Helmet Use Can Prevent Serious Injuries
Helmet Effectiveness Statistics
Helmet research summarized by the Centers for Disease Control and Prevention found that helmets reduce the risk of head injury by 69%. They are also estimated to be 37% effective in preventing rider deaths and 41% effective in preventing passenger deaths.
The latest national observation survey found that 73.8% of motorcyclists used DOT-compliant helmets in 2023. That was the highest estimate recorded by the survey at the time.
About 65% of motorcyclists killed in 2024 were reported as helmeted. That number does not show that helmets are ineffective. It does not account for how many riders wear helmets, whether the helmet met federal standards, the severity of each impact, speed, impairment, or the injuries that a helmet may have prevented.
Choosing a Compliant Motorcycle Helmet
All motorcycle helmets sold for on-road use in the United States must meet Federal Motor Vehicle Safety Standard No. 218. Look for the required DOT certification label and choose a helmet that fits evenly and securely around your head.
The NHTSA helmet-selection guide warns against thin “novelty” helmets and fake DOT labels. A compliant helmet should have a substantial energy-absorbing liner, a secure chin strap, and labeling that identifies the manufacturer and model.
Common Helmet Misconceptions
- “Helmets block too much vision.” A properly designed street helmet must meet federal field-of-view requirements and should allow normal head movement.
- “A helmet makes every crash survivable.” Helmets reduce risk but cannot overcome every impact force or prevent injuries to the neck, chest, abdomen, or limbs.
- “A DOT sticker means NHTSA approved the helmet before sale.” Manufacturers self-certify compliance. NHTSA tests selected helmets and can order recalls when products fail the standard.
- “A loose helmet is more comfortable.” A helmet that shifts easily may not stay correctly positioned in a crash.
Legal Helmet Requirements
Helmet laws vary by jurisdiction. As of July 2026, 17 states and the District of Columbia required all motorcycle riders to wear helmets. Other states covered only certain ages, permit holders, newly licensed riders, or passengers, while a few states had no motorcycle helmet requirement.
Check the current rule through your state motor vehicle agency or the IIHS motorcycle helmet-law table before riding. Do not rely on an old summary because state laws can change.
Note: Helmet use and legal compliance are separate questions. A helmet can reduce injury risk even where the law does not require an adult rider to wear one.
Motorcycle Fatalities by Age and Sex
Motorcyclist deaths are not limited to young or inexperienced riders. In 2024, 33% of motorcyclists killed were younger than 30, while 31% were age 50 or older. The average age of motorcycle riders killed was 40.
Men represented 92% of motorcyclist deaths, while women represented 8%. Most men who died were motorcycle drivers. Female fatalities included a much larger share of passengers.
These figures describe the people killed, not the risk faced by every member of an age or sex group. Accurate risk comparisons would also require information about the number of licensed riders, miles traveled, motorcycle type, riding environment, training, and behavior within each group.
How Motorcycle Accidents Compare to Other Road Incidents

Motorcycles were only 3% of registered vehicles in 2024, but motorcyclists accounted for 16% of traffic deaths and 20% of motor-vehicle occupant deaths.
Per 100 million vehicle miles traveled:
- The motorcyclist fatality rate was 28.00.
- The passenger-car occupant fatality rate was 1.05.
- The motorcyclist injury rate was 391.
- The passenger-car occupant injury rate was 86.
That means the motorcyclist fatality rate was almost 27 times the passenger-car occupant rate, while the injury rate was nearly five times as high.
The gap is smaller when rates are calculated per registered vehicle, because motorcycles are generally driven fewer miles per year than cars. Even under that measure, the motorcyclist fatality rate was more than six times the passenger-car occupant rate in 2024.
Must-Know Safety Tips for Every Motorcyclist
Wear Appropriate Safety Gear
Start with a correctly fitted, DOT-compliant helmet. Cover your arms and legs with abrasion-resistant clothing, wear over-the-ankle boots, and choose motorcycle gloves that protect your hands without limiting control movement.
Bright or reflective material can help other drivers detect you sooner. Armor in the shoulders, elbows, back, hips, and knees can add impact protection, but no item of gear can remove all injury risk.
Perform Pre-Ride Inspections
Before every ride, check:
- Tire pressure, tread, and visible damage
- Front and rear brakes
- Headlight, brake light, turn signals, and horn
- Oil, coolant, fuel, and other required fluid levels
- Throttle and clutch operation
- Chain or belt condition and adjustment
- Mirrors and controls
- Oil, fuel, or coolant leaks under the motorcycle
- Cargo security and load balance
Use the tire pressures and service limits in the motorcycle owner’s manual. Do not rely only on a generic checklist when the manufacturer specifies a different procedure.
Follow Traffic Regulations and Manage Your Space
Obey speed limits, traffic signals, lane markings, and passing rules. Leave enough space to brake or swerve when a vehicle turns, stops, or enters your lane.
Avoid staying beside a vehicle where its driver may not see you. Change lane position when needed to improve visibility, surface condition, and escape space. At intersections, reduce speed and cover the controls so you can react sooner.
Ride Sober and Rested
Do not ride after drinking alcohol or taking an impairing drug. Fatigue can also slow decisions and reduce attention. Stop when you become drowsy, unfocused, unusually irritable, or unable to hold a steady lane position.
Consider a Motorcycle With ABS
Antilock braking systems help prevent wheel lock during hard braking. This can allow a rider to retain more steering control and reduce the chance of a skid-related fall.
The Insurance Institute for Highway Safety reports that motorcycle ABS reduces crash risk and substantially lowers fatality rates for equipped motorcycles. ABS does not shorten every stop or replace proper braking practice, but it provides an important safety margin during emergencies.
Pro Tip: Practice emergency braking and swerving in a controlled area or approved training course. Build speed gradually and keep braking and swerving as separate actions unless your training specifically covers combined maneuvers.
Resources for Motorcycle Safety Training and Education
All states require a motorcycle license or endorsement, although testing and course rules differ. Some states require a rider course, while others waive the on-cycle skills test after a rider completes an approved program.
Use these resources:
- NHTSA Motorcycle Safety for licensing, gear, passenger, inspection, visibility, and sober-riding guidance.
- Your state motor vehicle agency for current licensing requirements and approved rider courses.
- Motorcycle Safety Foundation for course information and rider-training resources.
- NHTSA Recalls to check your motorcycle, tires, and safety equipment for open recalls.
New riders benefit from basic training, but experienced riders can also use advanced courses to sharpen cornering, braking, hazard perception, passenger, and low-speed control skills.
How to Interpret Motorcycle Crash Statistics
National statistics are useful, but they have limits:
- Fatalities are counts; injuries are estimates. FARS is a census of qualifying fatal traffic crashes, while CRSS uses a sample to estimate nonfatal injuries.
- Public-road data exclude many private-property events. A crash that occurs entirely on private land may not appear in national traffic-crash data.
- Rates need a denominator. A percentage of deaths, a rate per registered motorcycle, and a rate per mile traveled answer different questions.
- Helmet status does not prove helmet effectiveness. Effectiveness must be studied by comparing similar crashes and controlling for other factors.
- Weather percentages reflect exposure. More riding occurs during dry, warm weather, so a large clear-weather share does not mean rain is safer.
- Crash patterns do not establish fault. A left turn, front impact, speeding notation, or intersection location is one part of a complete investigation.
- Definitions can change. NHTSA’s vehicle-classification change in 2020 and motorized-bicycle change in 2022 affect long-term comparisons.
Frequently Asked Questions
What demographic factors contribute to motorcycle accident rates?
Age, sex, experience, motorcycle type, training, licensing, speed, impairment, and miles traveled can all affect crash exposure and risk. In 2024, 92% of motorcyclists killed were male, 33% were younger than 30, and 31% were age 50 or older. These shares do not measure each group’s risk unless exposure is also considered.
How does weather affect motorcycle crash statistics?
Rain, snow, wind, heat, and fog can reduce traction, comfort, and visibility. However, 97% of motorcyclist fatalities in 2024 occurred in clear or cloudy conditions, largely because far more riding takes place in suitable weather. That percentage does not mean wet roads are safer.
Are urban or rural areas more dangerous for motorcyclists?
More motorcyclist deaths occurred in urban areas in 2024: 66% versus 34% in rural areas. Urban roads have more intersections, turning vehicles, and traffic conflicts. Rural crashes may involve higher speeds, curves, animals, roadside objects, and longer emergency-response times. Counts alone do not show the risk per mile in each setting.
What role do motorcycle laws play in crash and injury rates?
Licensing, impairment, speed, equipment, and helmet laws can influence behavior and injury outcomes. Universal helmet laws are associated with higher helmet use and fewer unhelmeted deaths. Laws vary by state, so riders should verify current requirements through their state licensing agency.
How can I report unsafe motorcycle riding behavior?
Call 911 when the behavior creates an immediate danger, such as an active crash, extreme speeding, suspected impairment, or a rider traveling against traffic. For non-emergency concerns, contact the local police or highway-patrol non-emergency line. Provide the location, direction of travel, vehicle description, plate number if safely visible, and a factual description. Do not follow, confront, or record the rider while driving.
Are most fatal motorcycle crashes caused by left-turning drivers?
No. In 2024, the other vehicle was turning left in 45% of two-vehicle fatal crashes involving a motorcycle. That is a major pattern, but it excludes single-vehicle crashes and other multiple-vehicle situations. It also does not determine fault in every individual crash.
Do helmeted rider fatalities prove that helmets do not work?
No. The share of riders killed who wore helmets cannot measure helmet effectiveness by itself. Helmet research compares injury and death outcomes while accounting for exposure and crash factors. That evidence shows helmets reduce the risks of head injury and death, although they cannot prevent every fatal injury.
What is the latest year of complete U.S. motorcycle crash data?
The latest detailed final national motorcycle report covers 2024. NHTSA has also released a preliminary estimate suggesting motorcyclist deaths declined in 2025, but final 2025 motorcycle counts and detailed rates were not yet available as of July 2026.
Conclusion
Motorcycle crash statistics show that riders remain overrepresented in traffic deaths. The 2024 motorcyclist death total fell from the previous year, but the per-mile fatality rate was still almost 27 times the passenger-car occupant rate.
The strongest response is not one single piece of equipment or riding technique. Wear a compliant helmet and protective clothing, obtain the proper license, stay sober, control your speed, inspect the motorcycle, build emergency skills, and expect turning or merging drivers to overlook you. Drivers can help by checking carefully for motorcycles and allowing more following and turning space.
Statistics describe national patterns, not a rider’s destiny. Careful choices cannot remove every danger, but they can reduce avoidable risk and improve the chance of recognizing a hazard before it becomes a crash.
Sources
- NHTSA, Motorcycles: 2024 Data — fatalities, injuries, rates, crash characteristics, speeding, licensing, alcohol, and helmet statistics.
- NHTSA Motorcycle Safety — licensing, inspections, protective equipment, visibility, passengers, and responsible-riding guidance.
- CDC Motorcycle Injury Prevention — helmet effectiveness and universal helmet-law evidence.
- IIHS Fatality Facts: Motorcycles and ATVs — age, sex, crash type, helmet use, location, timing, and alcohol data.
- IIHS Motorcycle Helmet Use Laws — current state-by-state helmet requirements.
- NHTSA Early Estimates by Subcategory for 2025 — preliminary 2025 motorcyclist-fatality trend.







Leave a Reply